
How Spectroscopy Revolutionized Our Understanding of the Universe
Spectroscopy is defined as the “study of the absorption and emission of light and other radiation by matter” (“Spectroscopy,” Encyclopædia Britannica 1). The basic principle that this entire field of science rests on is that when excited, electrons jump energy levels. When a sample of an element is heated, it gains energy. This causes electrons to jump to a higher energy level. Eventually, they fall back to the level where they started, emitting energy in what is called a photon, which is a quantum of light. This photon will have a specific wavelength, which we see as a color. Each element will have its own variety of wavelengths it can emit, as the wavelength depends on the energy, as they are related by the Planck-Einstein relation, E=hf, where E is energy, h is Planck’s constant, and f is frequency, which is the reciprocal of wavelength. The amount of energy is dependent on the difference between the energy levels in the atom. Each element has its own specific spacing of energy levels. As stated in the Encyclopædia Britannica, “The energy levels are identical for atoms of the same type; allowed energies of a particular atom of silver are equal to those for any other atom of the same isotope of silver” (Encyclopædia Britannica 12). Therefore, if the color of light being emitted is known, the element can be identified. It is also important to note that an atom can absorb the same wavelengths of light that it can emit. This has numerous applications, not just in analytical chemistry, but also in astrophysics. From the smallest atom, to the light a star emits, we can follow the thread back through the chemistry of stars and cosmic expansion, unraveling the greatest mysteries, including the origin of the universe and life beyond earth, all through the use of spectroscopy.
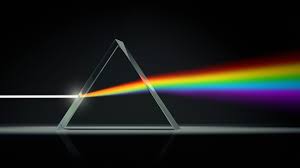
The study of spectroscopy largely began with Isaac Newton creating spectra from white light with a prism in 1666 (“The Era of Classical Spectroscopy,” 1), but it was not until Joseph Fraunhofer discovered and cataloged Fraunhofer lines, that the study became analytical. He took notice of dark lines in the spectra produced by sunlight passing through a diffraction grating, a series of slits made by winding a wire between the threads of a screw. The series of slits produces an interference pattern because light moves as a wave. The peaks and troughs of the wave meet, either adding to each other or canceling each other out. The interference pattern is seen as a spectrum. The use of a diffraction grating had a similar effect to Newton’s prism, but gave more control to the experimenter, as the prism absorbed certain wavelengths of light (“Spectroscopy,” Cavendish Square Digital 3). The dark lines he noticed indicated the absorption of certain wavelengths by an element, making essentially a map of the electron shells of the atom. This is known as the absorption spectrum. Gustav Kirchoff and Robert Bunsen discovered the opposite effect. They discovered that when heated, an element produces a spectrum of bright lines, which would be the emission spectrum. This led the physicist and the chemist to conclude that an element can produce both an emission and absorption spectrum, of which the wavelengths affected match (“Fraunhofer Lines”, 9). Whichever wavelengths an element emits, are also the wavelengths it can absorb. This goes back to the energy levels of the atom, and the fact that the light being absorbed or emitted must make an electron transition between energy levels, which is a very specific amount of energy.
Spectroscopy can be used to identify known elements as seen above, but it also can be used to discover new elements, when wavelengths observed don’t match those of any known elements. Joseph Lockyer was studying the emission spectrum produced by the sun, when it became clear to him that one of the lines produced in the spectra was previously unseen in any element. He concluded that this must be a new element, not found on Earth. This element is known as helium (“Fraunhofer Lines”, 12). Rubidium, cesium, thallium, and indium were also later discovered by the the use of a spectroscope, an instrument used to study the spectra of flames. They were each named for the color of their flame (“Spectroscopy (1855-1864),” 2).
Spectroscopy isn’t limited to use in analytical chemistry, it also has been used in astrophysics to justify the theory of cosmic expansion. When observing spectra produced by light from stars, Edwin Hubble noticed that Fraunhofer lines are shifted towards the red end of the spectrum, which has lower frequencies. It is known that the Doppler Effect explains how, as an object moves away from an observer, the waves it emits are elongated, lowering their frequency and increasing their wavelength. The opposite happens as the object moves away. The red shift observed in the spectra of starlight means that the star that is emitting the light is moving away from earth, and how far the lines are shifted can even show how fast the star is moving away. Edwin Hubble wrote in the presentation of his findings to the National Academy of Sciences about the fact that the new theory that redshift proves that the universe is expanding will not be easily accepted. But despite that, “ In the present status of observations and theory, we may evidently choose between a curious, small-scale uni-verse and a new principle of physics” (Hubble, 16). He knew that through the study of spectra, something big had been discovered. Something that proved that the universe is expanding. If we know that stars are moving away from us, that seems to suggest that the universe began all packed together, which would be explained by the Big Bang theory. Cosmic expansion could very well be the key to knowing where we started and where we are going.
Outside the origin of the universe, one of the biggest questions we face is whether or not life exists on other planets. Spectroscopy is being used to answer this as well. Dr. Sara Seager, a professor at the Massachusetts Institute of Technology, is using spectroscopy to study exoplanet atmospheres. By analyzing the contents of an exoplanet’s atmosphere, researchers can look out for biosignature gasses, or gasses that are produced by life. She describes how, “the bulk of atmosphere observations to date has been accomplished by the transit method, where transiting planets are those that go in front of their star as seen from the telescope. When the planet is in front of the star, some of the starlight passes through the planet’s atmosphere, picking up atmospheric spectroscopic features”(Seager, 15). The light shining through the atmosphere reveals the chemical makeup of the atmosphere, and could reveal evidence of alien life. So far, no signs of life have been found, but the research is still in progress.
Over the last 400 years, spectroscopy has offered us a window into how our universe formed, and allowed us to expand our knowledge beyond what we can see in front of us. Knowing how light travels and is shifted as it journeys through space and time can reveal the secrets of the universe, from how it all began, to whether or not we are truly alone. Spectroscopy is a valuable tool that has shaped our understanding of the cosmos.
Works Cited
“Analytical Chemistry.” Cavendish Square Digital, Cavendish Square Publishing LLC,
cavendishsquaredigital.com/article/84/analytical-chemistry. Accessed 8 Nov 2022.
“Fraunhofer Lines.” Cavendish Square Digital, Cavendish Square Publishing LLC,
cavendishsquaredigital.com/article/162/fraunhofer-lines. Accessed 8 Nov 2022.
Hubble, Edwin. “Effects of Red Shifts on the Distribution of Nebulae.” Proceedings of the
National Academy of Sciences United States of America vol. 22, Issue 11 (1936)
https://www.pnas.org/doi/epdf/10.1073/pnas.22.11.621. Accessed 28 Nov. 2022
Seager, Sara. “The future of spectroscopic life detection on exoplanets.” Proceedings of the
National Academy of Sciences of the United States of America vol. 111, Issue 35 (2014)
https://www.pnas.org/doi/10.1073/pnas.1304213111. Accessed 5 Nov. 2022
“Spectroscopy.” Britannica School, Encyclopædia Britannica, 29 Mar. 2021.
school.eb.com/levels/high/article/spectroscopy/110407. Accessed 4 Nov. 2022.
“Spectroscopy.” Cavendish Square Digital, Cavendish Square Publishing LLC,
https://cavendishsquaredigital.com/article/44/spectroscopy. Accessed 7 Nov 2022.
“Spectroscopy (1855-1864).” University of Waterloo -Chemistry, 5 Dec. 2019,
uwaterloo.ca/chemistry/community-outreach/2019-international-year-periodic-table-timel
ine-elements/spectroscopy-1855-1864.
“The Era of Classical Spectroscopy.” MIT Spectroscopy Lab – History,
web.mit.edu/spectroscopy/history/history-classical.html. Accessed 7 Nov 2022.

Sara is a senior who has been writing for EMC for six years. She is involved in many clubs, including Robotics, Impressions, Science Club, NHS, and EMC....